


In 2015, when AAP came to power, this was the situation of the Education sector in Delhi:
- Decades of neglect had left Delhi government school infrastructure in deep disrepair – with students and teachers having to spend their day in inhumane conditions
- Severe shortage of rooms and teachers
- Morale & motivation of teachers and principals at an all-time low
- Poor learning and literacy levels amongst students, with 3 out of 4 students in Class 6 unable to even read their textbooks
Now, in 2021, after AAP:
- Modernizing Infrastructure: Fixing acute shortage of classrooms, building schools of excellence with world class facilities
- Teacher Training: Capacity building of teaching staff and principals
- Accountability & Transparency: Making school administration accountable and admissions transparent
- Improving Learning outcomes through interventions such as Chunauti, Mission Buniyaad, the acclaimed Happiness Curriculum, Deshbhakti and Entrepreneurship Mindset Curriculum (EMC).
- Setting up High-Quality Higher Education Institutes: Delhi Skills & Entrepreneurship University, Teacher’s University and Sports University set up.
| Before 2015 | Now | % change | Data Source | Graph | |
| Annual allocation of yearly education budget | 2008 to 2014: 12% | 2014 to 2022: 19% | 7 percentage points increase | DDC Performance Report (2015-2021): Education (Page 5) | 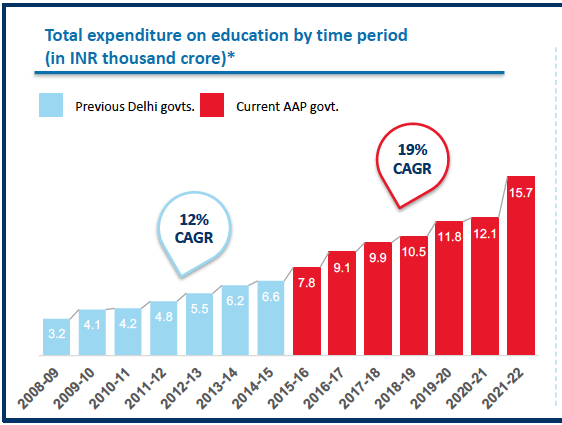 Total Exp Total Expenditure on Education |
| Yearly education expenditure as % of aggregate expenditure | 2008: 14% 2014: 16% | 2021-2022: 25% (National average (2021-2022):16%) | 7 percentage points increase | DDC Performance Report (2015-2021): Education (Page 7) | 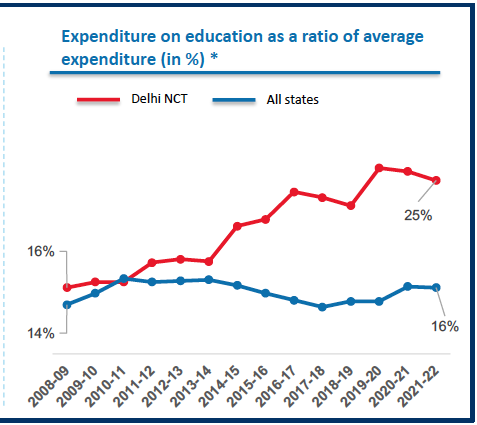 Education expenditure percentage Education expenditure percentage |
| CBSE Class 12 Pass Percentage | 88.1% | 2021: 99.9% (Private Delhi schools: 99.7% ; National (2020): 88.8%) | 11.8 percentage points increase | DDC Performance Report (2015-2021): Education (Page 46) | 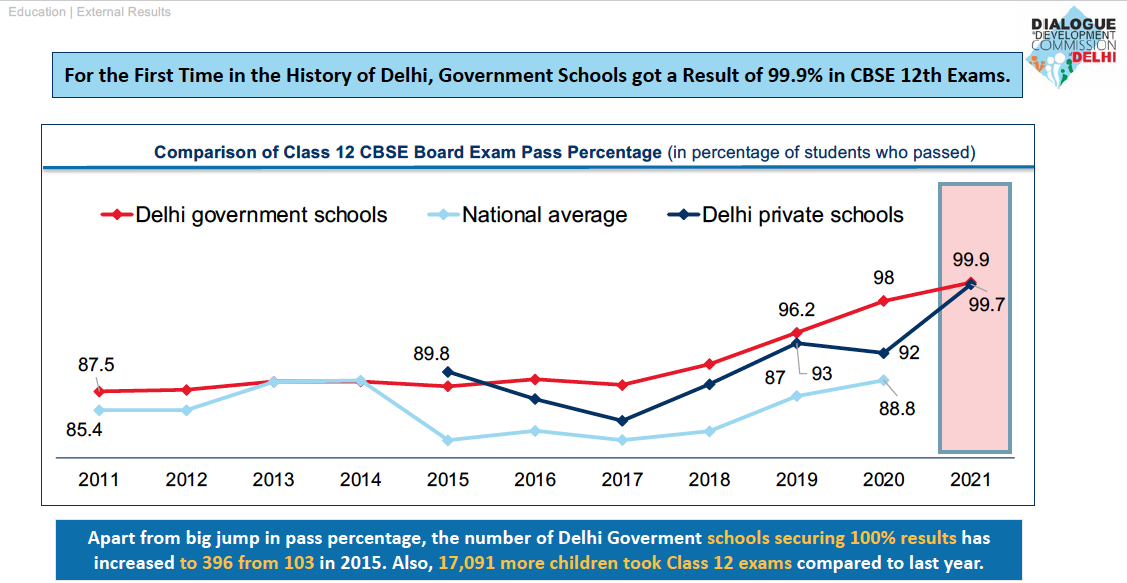 Class-12 results versus private and national average Class-12 results versus private and national average |
| CBSE Class 10 Pass Percentage | 2019: 71.58% 2020: 82.61% | 11.03 percentage points increase in just 1 year | Status Report of Outcome Budget (2020-2021) (Page 8) | ||
| Number of new schools built | 2015-2021: 26 new schools built & 21 new schools under construction(as of Mar 2022) | DDC Performance Report (2015-2021): Education (Page 9) |  New schools built New schools built | ||
| Number of classrooms | 2015: 24,157 | End-2021: 45,285 | 87% increase | DDC Performance Report (2015-2021): Education (Page 9) | 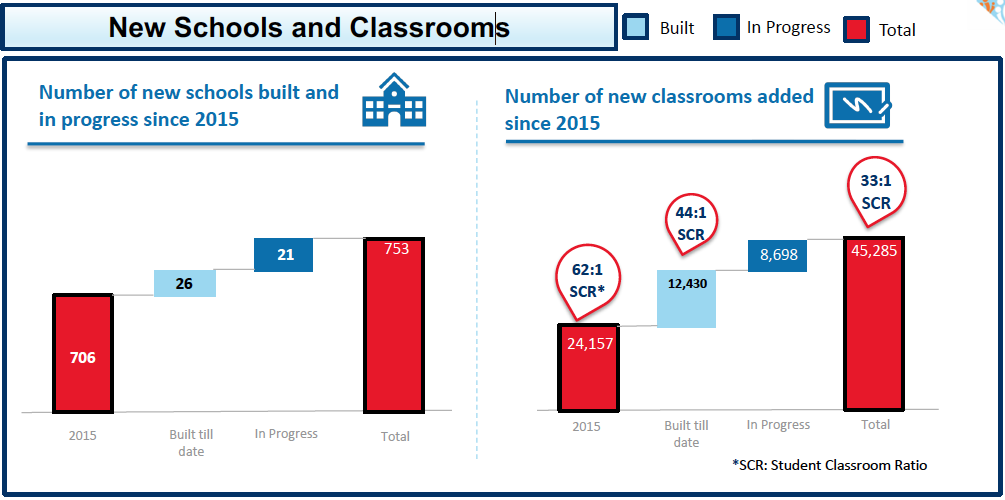 New classrooms built New classrooms built |
| SCR – student-classroom ratio | 62:1 | 44:1 (Adding under-construction classrooms at end-2021: 33:1) | 29% improvement (Planned: 47% improvement) | DDC Performance Report (2015-2021): Education (Page 9) | New classrooms built |
| Teacher vacancies | 18,739 | 5,666 | 70% decrease | DDC Performance Report (2015-2019): Education (Page 15) |  Teacher vacancies Teacher vacancies |
| No. of govt school teachers | 37,154 | 58,358 | 57% increase | DDC Performance Report (2015-2019): Education (Page 15) | No. of govt school teachers |
| No. of teachers undergoing training annually | 2014-2015: 34,000 | 2020-2021: 1,17,000 | 244% increase | DDC Performance Report (2015-2021): Education (Page 18) | 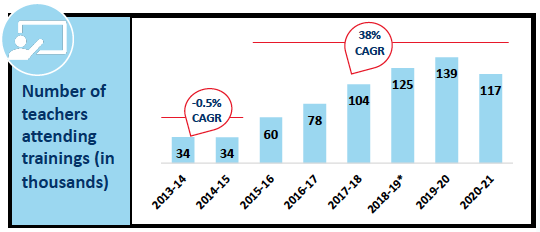 Teachers attending training Teachers attending training |
| Annual Teacher training budget | 2014-2015: 7.4 crore | 2020-2021: 43.3 crore | 485% increase | DDC Performance Report (2015-2021): Education (Page 18) | 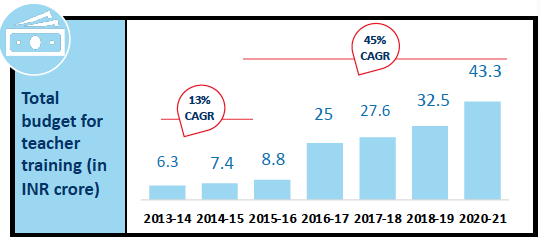 Teacher training budget Teacher training budget |
| No. of teachers/Principals trained abroad | – | 1407 | – | DDC Performance Report (2015-2021): Education (Page 18) | 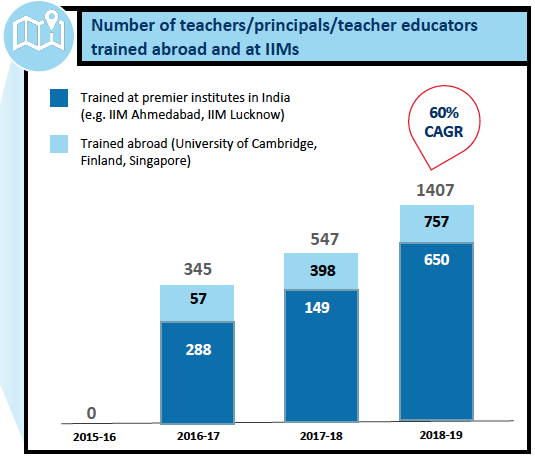 No. of teachers/Principals trained abroad |
| Subsidy for School Uniforms per student | Rs 500-900 | Rs 1100-1400 | app. 79% increase | DDC Performance Report (2015-2021): Education (Page 28) | 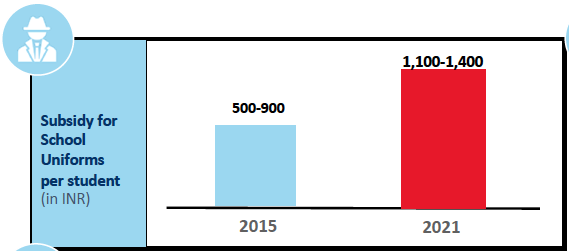 School uniform subsidy per student School uniform subsidy per student |
| Budget for libraries | 1.7 crore | 9 crore | 429% increase | DDC Performance Report (2015-2021): Education (Page 28) | 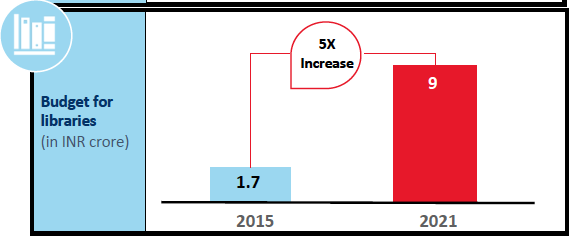 Budget for libraries Budget for libraries |
| Students who could read their grade-level text books | 2015: 48% | After Mission Chunauti: 63% | 15 percentage points improvement | DDC Performance Report (2015-2019): Education (Page 31) |  Chunauti 2018 – before and after Chunauti 2018 – before and after |
| Students who could solve their grade-level Maths problems | 2015: 56% | After Mission Chunauti: 73% | 17 percentage points improvement | DDC Performance Report (2015-2019): Education (Page 31) | Chunauti 2018 – before and after |
| Merit scholarships offered to students scoring 80%+ | 2015: Rs. 2000 (income limit 2 lakhs) | 2021: Rs. 2500 (no income limit) | 25% increase | DDC Performance Report (2015-2021): Education (Page 28) | 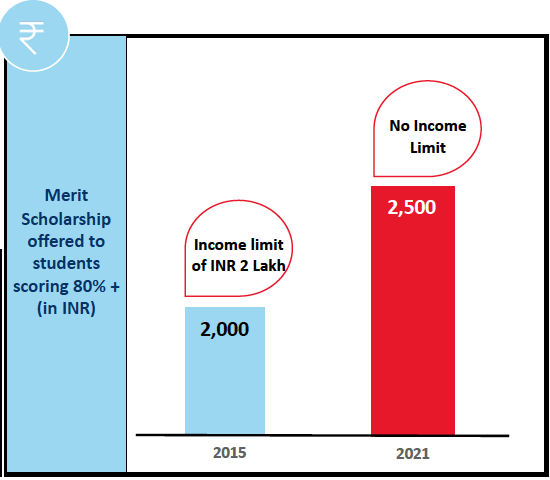 Merit scholarship offered |
| Enrolment in government schools | 2015: 15.15 lakh | 2021: 17.67 | 2.5 lakh joined from private to government schools | DDC Performance Report (2015-2021): Education (Page 48) | 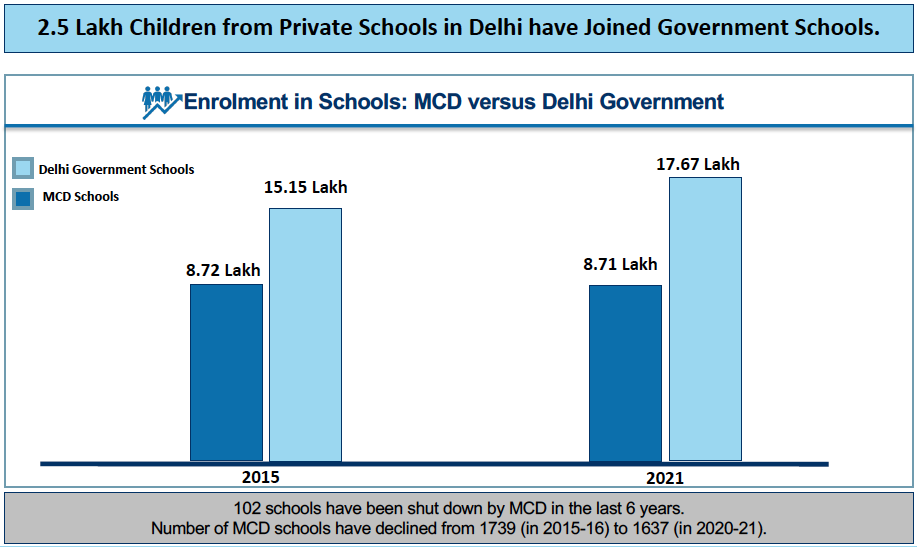 Enrolment in government schools |
| No. of EWS/DG quota admissions in govt schools | 2015 – no data managed by previous govt | 2015-2016 (AAP govt): 13,500 2019-2020:app. 36,000 | 166% increase in 4 years within the AAP term | DDC Performance Report (2015-2019): Education (Page 40) | 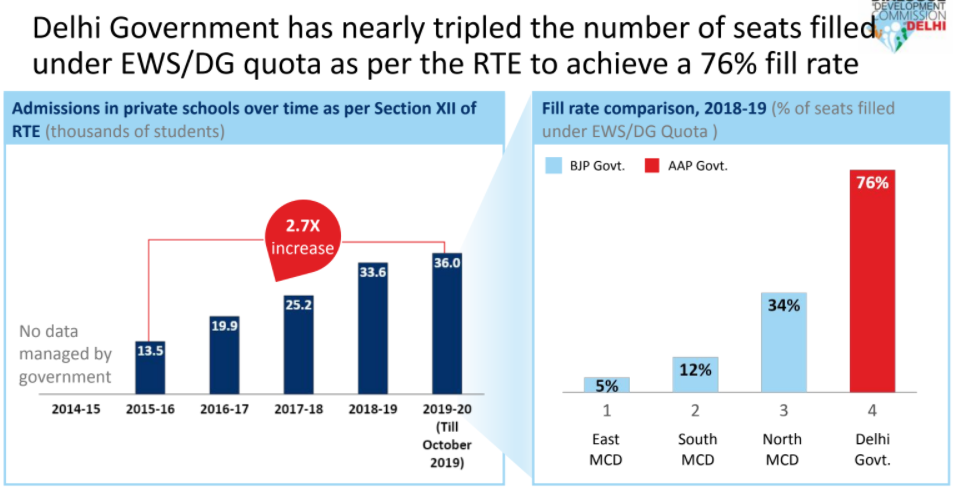 No. of EWS/DG quota admissions in govt schools No. of EWS/DG quota admissions in govt schools |
| EW/DG quota seats fill rate | 2015 – no data managed by previous govt | 2018-2019:76% (AAP govt schools) (Schools under BJP-run MCDs: East – 5% South – 12% North – 34%) | DDC Performance Report (2015-2019): Education (Page 40) | EWS/DG admissions – Government vs MCD schools | |
| Participation in National Games | 2,468 | 4,194 | 70% increase | DDC Performance Report (2015-2019): Education (Page 12) |
When expressing your views in the comments, please use clean and dignified language, even when you are expressing disagreement. Also, we encourage you to Flag any abusive or highly irrelevant comments. Thank you.